Sometimes customers ask questions like this about the error reports:
Is there a way we can subscribe to the CER reports? like if i enabled it could we get reports that mean something to us? or is it always going to be low-level debug info for developers only?
Well, the CER reports are mostly low-level details, like call and thread stacks, that are useful only to our developers. But sometimes these can provide an obvious clue (for example, Softimage is crashing while parsing an addon XML file). Other times they don’t tell a non-developer like me [or maybe you] much.
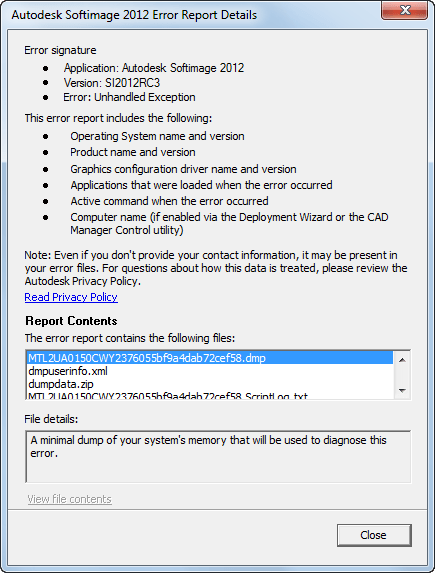
CER reports are basically call stacks (like the one I sent before) and crash dump files (which are saved in the user folder after a crash). The reports do also include some info about the OS and the graphics card, which can be useful to the support agent.
Our internal CER tools do some grouping of crash reports based on the area of the code where the crash happened, which can be useful as an aggregate measure. You can read more about CER here.
If you want to view the CER files, you can do that before you send or cancel the report. Just click View Report Details. You can even grab the report files if you want: some are in your Softimage user folder, and others are in the %TEMP% folder (in a XSI_Temp subfolder that is removed when XSI.exe exits).


